Essential Data Analytics & Business Intelligence Tools for Aspiring Data Analysts
The modern digital economy thrives on data, powering nearly every strategic decision in business, healthcare, finance, logistics, and countless other sectors. As organizations generate massive volumes of data daily, the need for skilled professionals who can decipher, analyze, and transform raw data into actionable business intelligence is at an all-time high. Central to this capability is mastery of key data analytics and business intelligence (BI) tools—platforms that enable analysts to organize, visualize, and make sense of intricate data sets. Read to find out Essential Data Analytics & BI Tools for Data Analysts
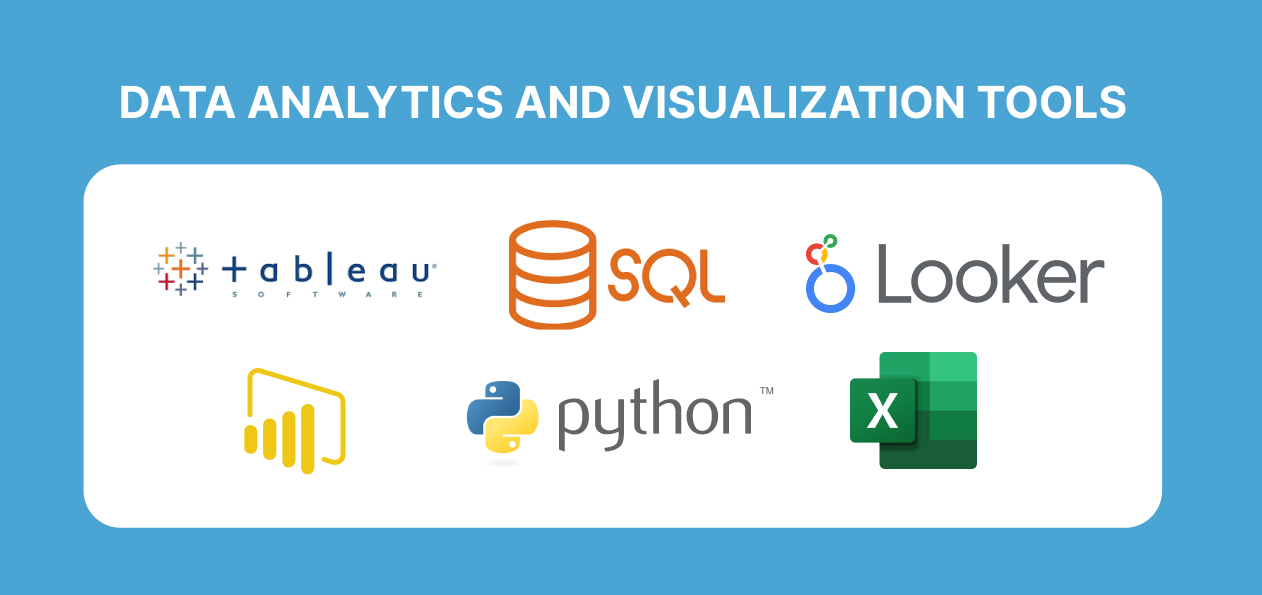
For jobseekers eyeing a career as a data analyst or BI specialist, knowing which tools to learn and become proficient in is crucial. The right skills not only make you more hirable but also equip you with the versatility to excel in real-world analytics scenarios. This blog will walk you through the most in-demand analytics tools for 2025: SQL, Excel, Power BI, Tableau, and SAS. It will elaborate on each tool’s value, the skills you should gain, and the certifications that boost your appeal to employers.
Key Data Analytics & BI Tools: Summary Table
Tool
Core Use Case
Strengths
Typical Employers/Scenarios
SQL
Data querying, cleaning, transformation
Ubiquitous in data storage; essential for relational DBs; supports complex operations, joins
Nearly all industries using relational databases (finance, e-commerce, logistics, healthcare)
Excel
Data wrangling, basic analytics, dashboards
Universally used for calculations, charting, quick reporting, pivot tables
Entry-level analytics, SMEs, business reporting, first-step cleaning
Power BI
Data modeling, interactive dashboards, business intelligence
Tight integration with Microsoft stack, drag-and-drop dashboards, cloud connectivity
Enterprises with MS infrastructure, real-time business monitoring
Tableau
Data visualization, interactive dashboards
Leading in rich, interactive, shareable visualizations; intuitive drag-and-drop
Consulting, marketing, finance, agencies, business dashboards
Trusted in highly regulated industries; robust statistical methods and security
Healthcare, pharma, finance, insurance, government
Table Analysis:
Aspiring data analysts should focus on learning SQL for querying and managing data, Excel for foundational analytics, Power BI and Tableau for modern BI dashboards and visualizations, and SAS for specialized analytics (especially if targeting regulated or Fortune 500 sectors).
Mastering SQL: The Foundational Language of Data Analysis
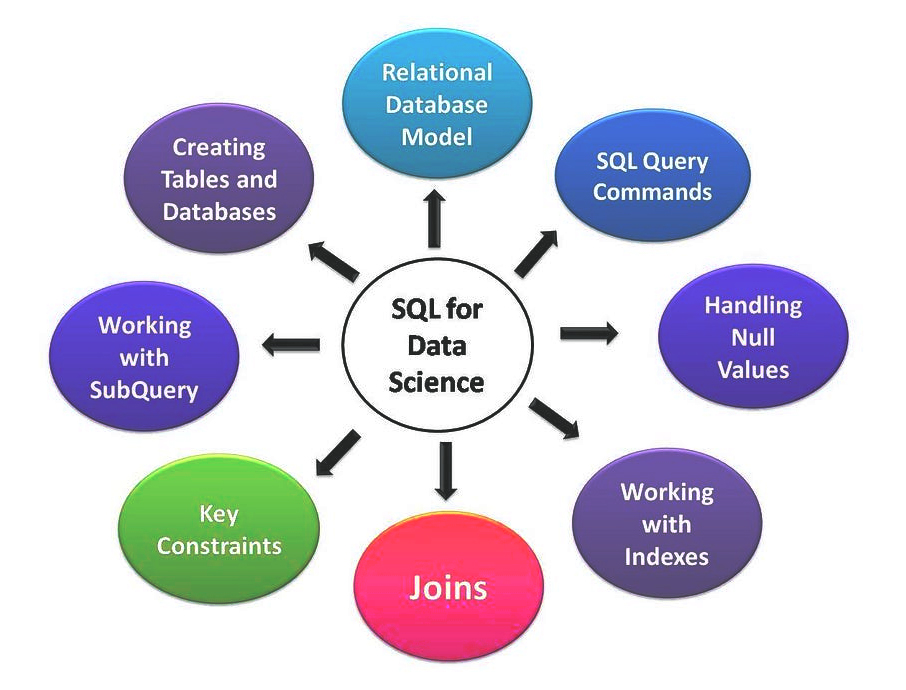
Structured Query Language (SQL) is the DNA of modern data analytics. Almost every organization—from startups to global enterprises—stores their core data in relational databases (like MySQL, PostgreSQL, SQL Server, or Oracle). SQL is the universal language to retrieve, manipulate, and analyze that data efficiently.
How Data Analysts Use SQL
Querying & Aggregating Data: Analysts use SQL to select, filter, and aggregate massive datasets—finding trends, calculating averages or sums, and segmenting data by category or time period.
Joining Multiple Data Sources: Most valuable data is spread across tables (e.g., orders, customers, sales). SQL’s join operations let analysts create rich, multi-faceted views crucial for business intelligence.
Data Cleaning & Transformation: Removing duplicates, handling missing values, and restructuring messy data are often performed directly via SQL before visualization or reporting.
Reporting & Automating Extracts: Dynamic SQL queries feed business dashboards, BI platforms, and automated pipelines.
Example SQL Use Cases
A retail analyst pulls last month’s sales by store, product, and region, then identifies underperforming products with a GROUP BY, JOIN, and WHERE clause.
A marketing analyst segments email subscribers by engagement, purchasing history, and demographics using SQL joins and filters.
Why SQL Is Non-Negotiable for Careers
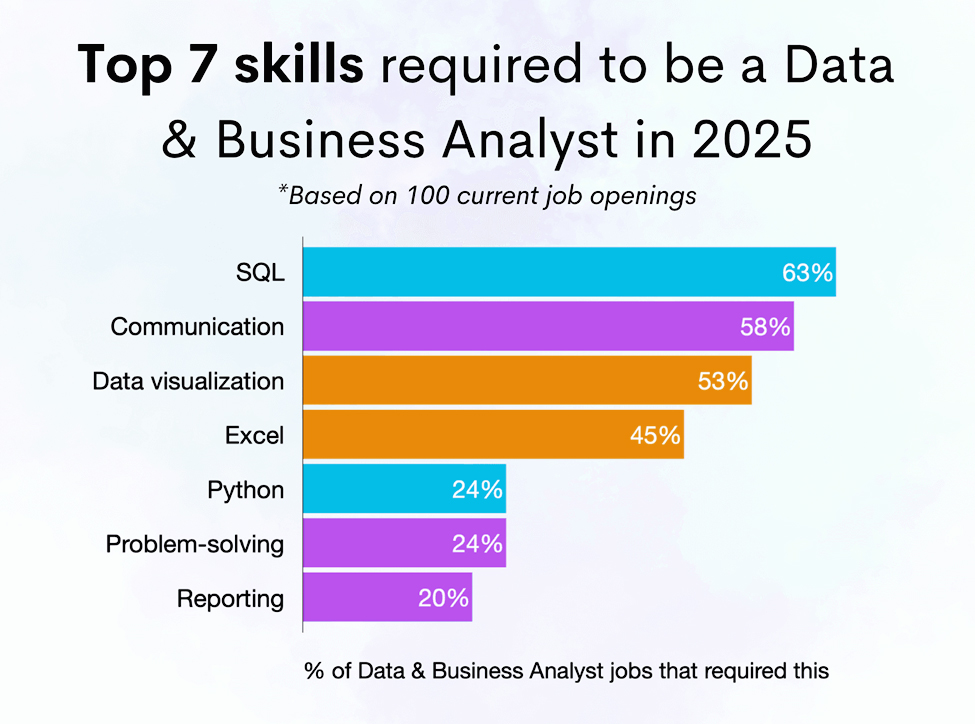
SQL is the #1 must-have technical requirement in data analyst job descriptions.
Roles that require SQL proficiency range from entry-level business analysts to senior BI developers, financial analysts, and data engineers.
Nearly all modern BI tools (Power BI, Tableau, Looker, even Excel’s Power Query) support SQL integration and benefit from strong SQL foundations.
Google Data Analytics Professional Certificate (covers SQL fundamentals, real-world projects)
Microsoft Certified: Azure Data Fundamentals (includes hands-on SQL training)
Recommendation:
Master SQL before moving to advanced analytics or visualization tools. Leverage online courses with exercises on real business datasets, and practice interview questions (such as those from Synergisticit.com .
Excel: The Analytics Workhorse for Business Intelligence
Despite the rise of specialized analytics tools, Microsoft Excel remains the most-used analytics platform worldwide—especially for entry-level analysts and business professionals.
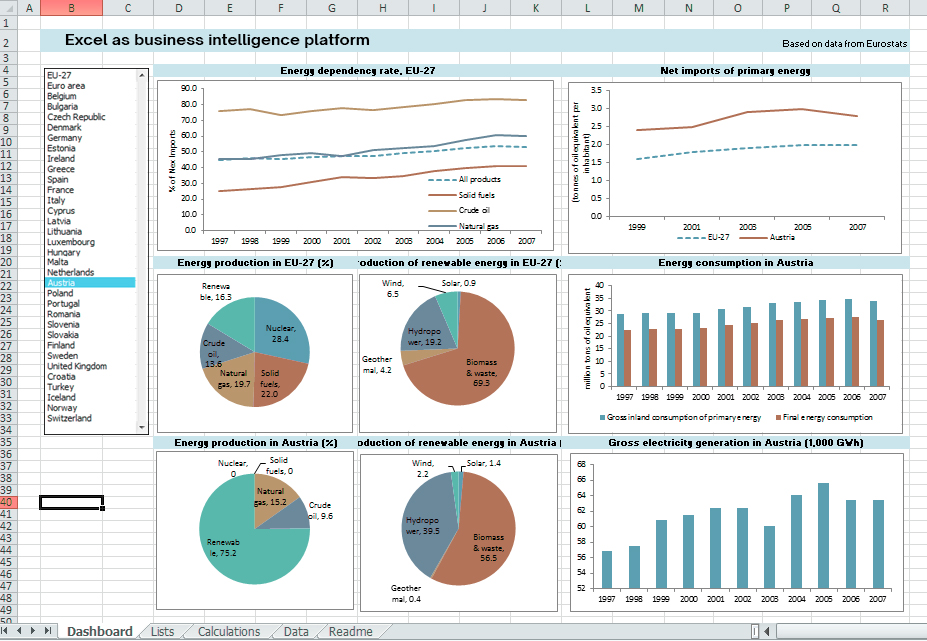
Excel as business intelligence platform
How Excel Powers Data Analysis
Data Cleaning & Manipulation: Sorting, filtering, deduplication, and data reshaping—all accessible via the Excel UI.
Calculation & Statistical Analysis: Sum, average, count, standard deviation, conditional formulas (SUMIF, COUNTIF, VLOOKUP, INDEX/MATCH) enable anything from KPI dashboards to budgeting models.
Pivot Tables & Charts: The single most powerful Excel feature for summarizing and visualizing complex data sets, allowing for interactive exploration, grouping, and filtering.
Ad hoc Reporting: Quick, custom analyses with instant visuals—indispensable for business meetings and rapid insights.
Example Excel Use Cases
Tracking sales by product, region, month, and salesperson with a single drag-and-drop Pivot Table.
Cleaning survey data by removing blanks, standardizing responses, and creating summary charts with slicers.
Excel’s Limitations—and Why You Must Still Learn It
Scalability: Slows down with large datasets (hundreds of thousands or millions of rows).
Error-Prone: Formulas can break, and manual errors are common; thus, not ideal for “single source of truth” analytics in large enterprises.
Not Meant for Automation: Not the best for creating reproducible, automated analytics pipelines.
Microsoft Office Specialist: Excel Associate (Excel and Excel 2019)
Google Data Analytics Professional Certificate (Excel module)
Power BI: Transforming Data into Business Intelligence
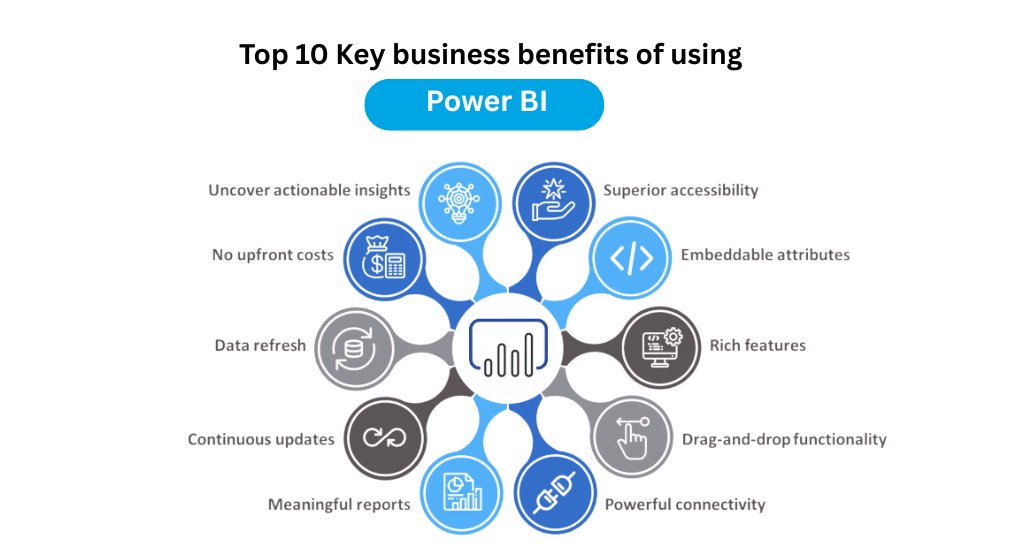
Microsoft Power BI is a leading BI platform that lets users connect, model, and visualize data from nearly any source—cloud or on-premise. Its power lies in its accessibility, real-time analytics, and seamless integration in Microsoft-centric organizations.
How Power BI Enhances Analytics Careers
Data Modeling: Allows analysts to transform disorganized data into business-friendly, relational data models (star schemas); supports calculated columns and measures with DAX (Data Analysis Expressions).
Interactive Dashboards: Drag-and-drop dashboards with dynamic filters, slicers, and drill-downs—ideal for executive presentations and KPI tracking.
Live Data & Collaboration: Connects to real-time data sources; dashboards can auto-refresh as data updates.
AI-Powered Insights: Power BI leverages built-in AI features (smart narrative, anomaly detection) for advanced analytics.
Example Power BI Use Cases
Building a dashboard to monitor sales performance by division, region, and product line—with drill-through to individual rep detail.
Creating real-time operational dashboards driving decisions for logistics, HR, finance, or customer support.
Why Learn Power BI?
Job Market Demand: Many large organizations and enterprises, especially those on Microsoft Azure or using Office 365, require Power BI skills for analyst roles.
Entry & Advanced Analyst Roles: Suitable for both foundational and advanced analytics; widely expected alongside SQL and Excel in job descriptions.
Cost-Effective: Offers a free desktop tool for learning and development.
Recommended Steps
Start with Microsoft’s free Power BI Desktop, connect to sample datasets, and build simple dashboards. Progress to the official Power BI Data Analyst certification to validate your skills for employers.
Tableau: Visual Storytelling with Data
Tableau is the gold standard for creating rich, interactive data visualizations and dashboards. Its intuitive drag-and-drop interface, powerful analytics capabilities, and broad data connectivity make it the first choice for many analysts, consultants, agency data teams, and business intelligence specialists.
Tableau Features & Advantages
Easy Visualization: Quickly build bar charts, heatmaps, scatterplots, treemaps, and custom dashboards by dragging dimensions and measures into place.
Cross-Platform: Works seamlessly across desktop, web, and mobile; dashboards can be easily shared via cloud or server.
Data Source Integration: Connects to SQL, Excel, Google Sheets, cloud data warehouses, big data systems, and more.
Interactivity: Drill-downs, filters, and parameters support real-time exploration and discovery for both technical and non-technical audiences.
Advanced Analytics: Incorporates statistical models, trend lines, clustering, and forecasting features; integrates with R and Python for custom analytics.
Example Tableau Use Cases
Visualizing product sales by geography, channel, and timeframe to identify growth opportunities.
Building dashboards to monitor campaign effectiveness across marketing channels, with drill-through into campaign specifics for optimization.
Google Data Analytics Professional Certificate (Tableau fundamentals)
SAS: The Powerhouse for Advanced Analytics and Regulated Industries
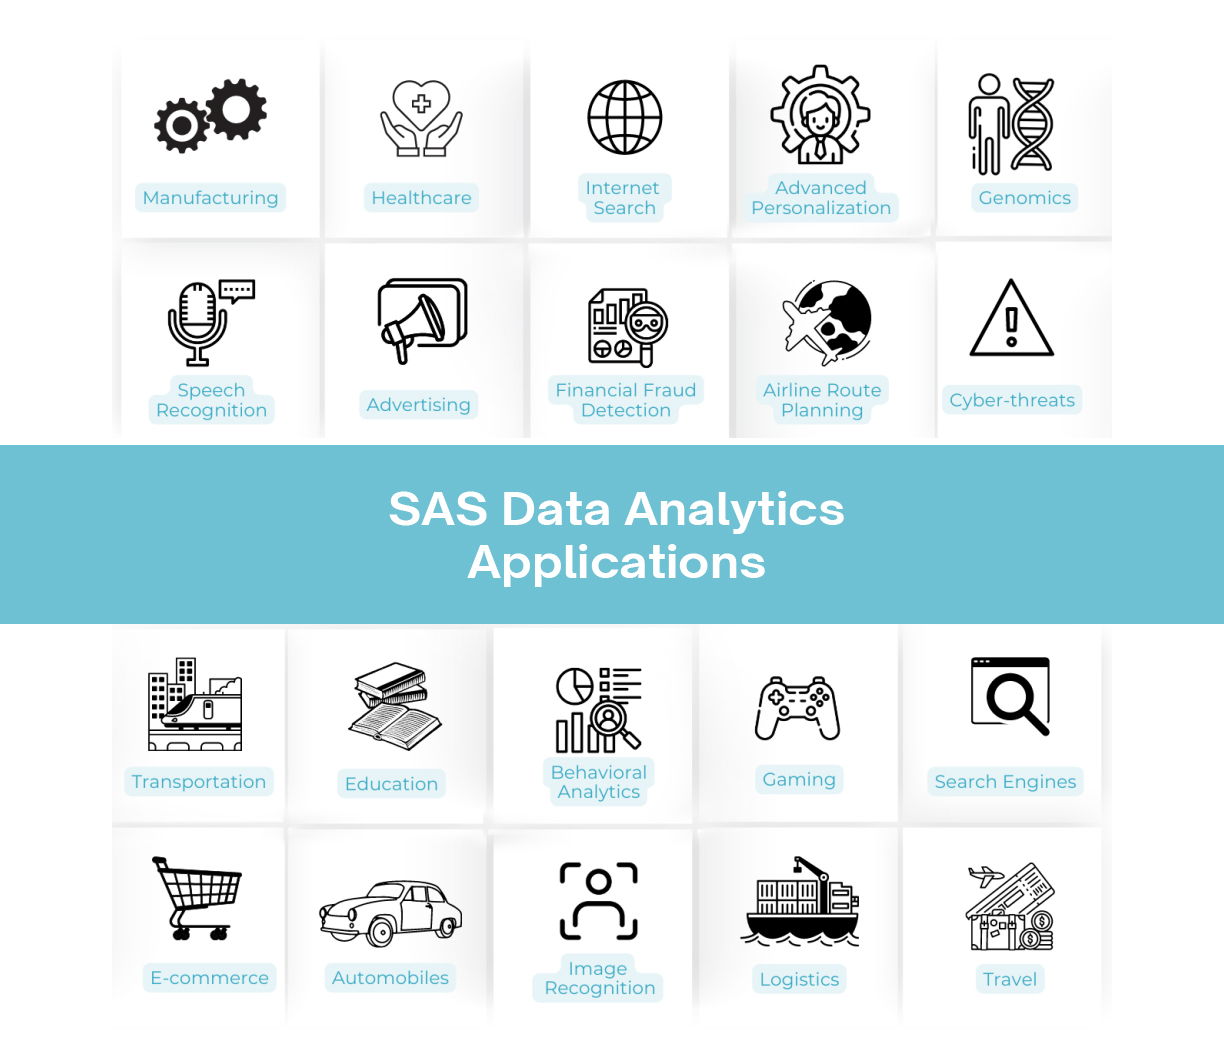
SAS (Statistical Analysis System) stands apart as a premium, enterprise-grade analytics suite preferred in companies where data governance, privacy, and complex modeling are non-negotiable.
What Makes SAS Unique?
Statistical & Predictive Analytics: SAS offers deep statistical procedures for regression, ANOVA, multivariate analysis, data mining, quality control, and more.
Robust Data Management: Integrates, cleans, and prepares massive, complex datasets from disparate sources—including mainframes, databases, flat files, and more.
Enterprise Security & Compliance: Adopted in healthcare, pharma, insurance, and finance because of stringent data security, compliance, and privacy standards.
Machine Learning & AI: Supports both classic predictive analytics (time series, optimization) and modern ML (decision trees, neural networks).
Example SAS Use Cases
Healthcare analyst uses SAS for clinical trial data management, ensuring privacy compliance and running advanced statistical tests.
Financial institution runs credit risk modeling and fraud detection algorithms using SAS due to regulatory requirements.
SAS Certified Data Scientist (recommended for analysts in healthcare, finance, or advanced data modeling roles)
The Analytics Toolset: Choosing What to Learn—And Why
No single tool solves every analytical challenge. Here’s how to strategize your learning path:
Start with SQL and Excel as foundational analytics languages (regardless of industry or job title)
Add Tableau and/or Power BI for robust, modern data visualization and full-scale BI dashboards—choose Power BI if targeting Microsoft-centric companies, Tableau for a broader analytics or consulting/agency focus.
Learn SAS if you aim for highly regulated industries, advanced statistical roles, or Fortune 500 analytics teams.
Certify Your Skills: Stand out in the job market with recognized, vendor-backed certifications. Many online bootcamps, Coursera programs, and university extension courses offer hands-on training combined with certification pathways.
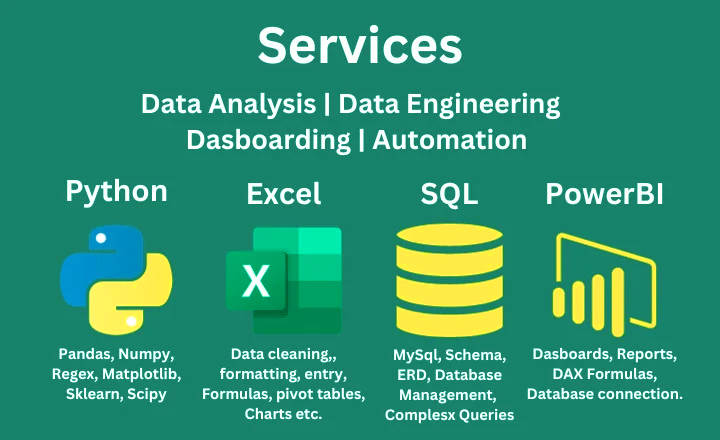
Complement Your Stack with Python and machine learning if you want to advance into data science—but for a pure data analyst/BI role, SQL, Excel, Power BI, Tableau, and possibly SAS are the foundation.
Top Data Analyst Certifications for Jobseekers (2025)
SynergisticIT’s Job Placement Program: Your Proven Pathway to Analytics & BI Roles
SynergisticIT is a premier job placement and upskilling provider with over 15 years of tech industry experience, a 91.5% placement rate, and thousands of alumni in high-profile roles at companies such as Google, Apple, Cisco, Amazon, Wells Fargo, and more.
What Sets SynergisticIT Apart?Comprehensive, Real-World Curriculum:
SynergisticIT’s training blends practical skills (SQL, Excel, Python, Tableau, Power BI, AWS, data engineering) with industry-standard best practices. Candidates work on real business datasets, capstone projects, and develop both hard and soft skills necessary for landing well-compensated roles.
Expert Faculty & Mentors:
Instructors average 10+ years of field experience in data science, analytics, software engineering, and cloud computing. Live instructor-led sessions ensure you’re learning from professionals who know what the job market demands.
Hands-On Job Support:
Resume branding, technical and behavioral interview training, mock interviews, and access to a database of 5000+ real interview questions prepare you for what large companies actually ask.
Personalized Career Marketing:
Your skills are marketed directly to SynergisticIT’s vast client network (over 24,000 tech employers)—far beyond what traditional bootcamps or online courses offer.
Certifications & Upskilling:
Includes training (at no additional cost) for leading certifications: Oracle Certified Java Professional, AWS Solutions Architect, Power BI, SAS, and more.
Results-Driven Model:
Partial fees are paid upfront; the remaining tuition is only due if placed in jobs with $81k+ annual salary, illustrating strong confidence in job outcomes.
Why SynergisticIT’s Placement Matters
High Placement Rates & Salaries:
91.5% placement rate; average starting salaries for graduates are $86,000–$150,000, outpacing college averages or other bootcamps.
Direct Industry Feedback:
Programs are updated regularly based on tech employer requirements shared at events like Oracle CloudWorld and Gartner Data & Analytics Summit.
Visa and Career Gap Support:
Specialized support for F1 OPT and STEM candidates, as well as jobseekers looking to transition industries or return from career breaks.
Job Market Trends, Interview Strategies, and Success with SynergisticIT
What Employers Are Seeking
Proven Hands-On Skills: Not just textbook knowledge—real portfolio projects, dashboard samples, and problem-solving.
Certifications: A mark of seriousness and verified ability. Google, Microsoft, SAS, and AWS certs can rapidly expand your opportunities.
Interview Readiness: Understanding real-world business cases, explaining data insights concisely, and adeptly navigating technical and behavioral interview questions.
To break into data analytics and BI in 2025, focus your energies on:
Mastering SQL and Excel for foundational analysis and data preparation.
Becoming proficient with at least one modern BI/visualization tool (Power BI or Tableau).
Learning SAS if targeting highly regulated or enterprise F500 sectors.
Earning at least one vendor-backed certification (Google, Microsoft, or SAS recommended).
Building a portfolio of analytics projects, real dashboards, and documented case studies to showcase your ability to deliver business value.
Leveraging a high-impact job placement program like SynergisticIT’s to maximize your practical readiness, access exclusive job networks, and receive comprehensive support—including resume branding, interview prep, and direct marketing to tech clients.
Continuing to build your knowledge and stay current via blogs, workshops, and communities.
Ready to future-proof your analytics career? Begin with the essential BI tools, get certified, and let SynergisticIT’s proven job placement process take your career to the next level!For more industry updates, jobseeker stories, and career tips, check out the SynergisticIT blog.

 For jobseekers eyeing a career as a data analyst or BI specialist, knowing which tools to learn and become proficient in is crucial. The right skills not only make you more hirable but also equip you with the versatility to excel in real-world analytics scenarios. This blog will walk you through the most in-demand analytics tools for 2025: SQL, Excel, Power BI, Tableau, and SAS. It will elaborate on each tool’s value, the skills you should gain, and the certifications that boost your appeal to employers.
 Why Learn Power BI?
 Learning Resources & Certifications
 What Employers Are Seeking